Rene 5
Page in progress
INTRODUCTION
In this work, four different options of design for the Loft Storage will be analyzed. They are:
- 2×8 joists, spaced 24 inches from each other
- 2×10 joists spaced 24 inches from each other
- 2×8 joists, spaced 16 inches from each other
- 2×10 joists spaced 16 inches from each other
LOADS
The combination of loads chosen to check the loading capacity of this loft was (L+D), where “L” is the live load (whose maximum value we are looking for) and “D” is the dead load (whose components are both the weight of the plywood layer, “D1”, and the weight of the own joists, “D2”).
- D2 will act only on the superior part of the joists, which means that D2 times the cross area of the joist will give us the linear load (lb/ft) corresponding to D2. Considering Douglas Fir-Larch (north, No. 2 or better), whose average density in lb/ft3 is 32, will be used in this project, this number is 2.418 lb/ft for 2×8’s and 3,083 lb/ft for 2×10’s
- Both L and D1 will act on the areas inside the interior walls. Then, they need to be distributed to each joist according to their influence areas. How those areas were divided is shown in the figures below:
 and for 16'' O.C. (b).")
For example, if we go with joists 24’’O.C., in order to see which fraction of the load W = (D1 + L) will act on the joist 1 (the first red line, from left to right), three different loads were considered. That’s the part of this joist that will be in between interior walls (i.e., that will receive this load W): the others (the dark blue lines, 1.9 ft each, will receive just the load D2.

The first one is the green rectangle at its right and, linearly (lb/ft), it will be W times its width (in this case, 1 ft) and will act on the entire length of the joist inside the interior walls.

The second one is the bigger blue triangle. This will be converted to a triangular load, whose maximum value (that happens at mid-span) will be W times the distance between the joist and the extreme point of the triangle (1.8 ft). At the ends of the joist, this load will be zero.

The last load to be considered is the small triangle, just above the red rectangle. This load, at a 2D analysis, will be a triangular one starting with W times its base (1 ft) and ending with zero at a distance equals its high (also 1 ft).

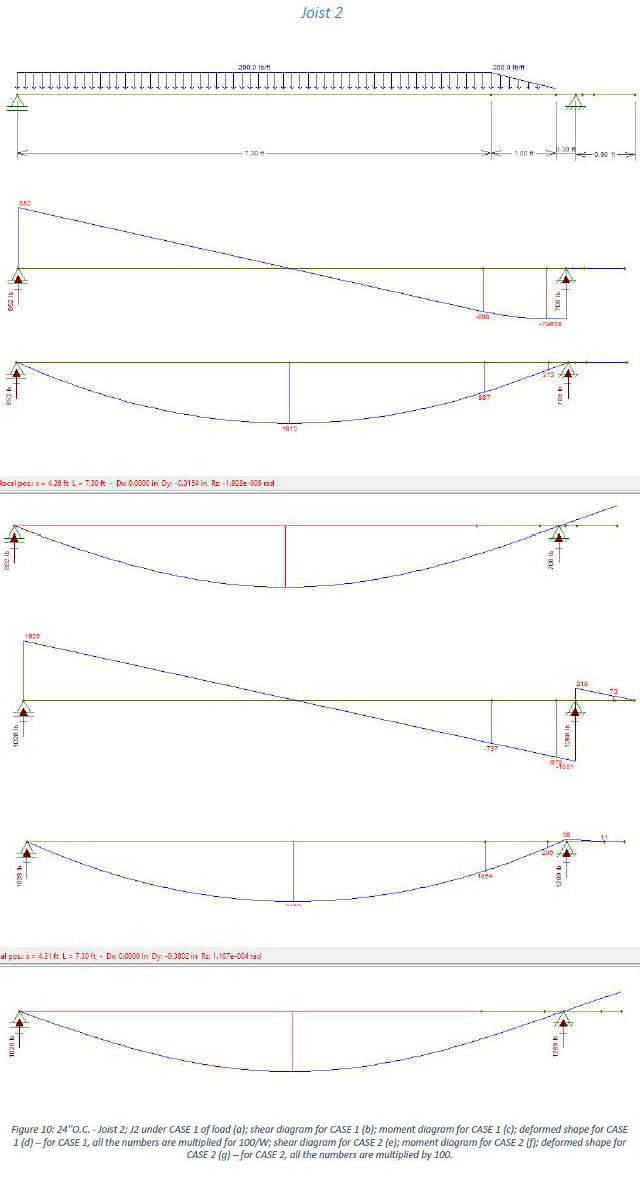
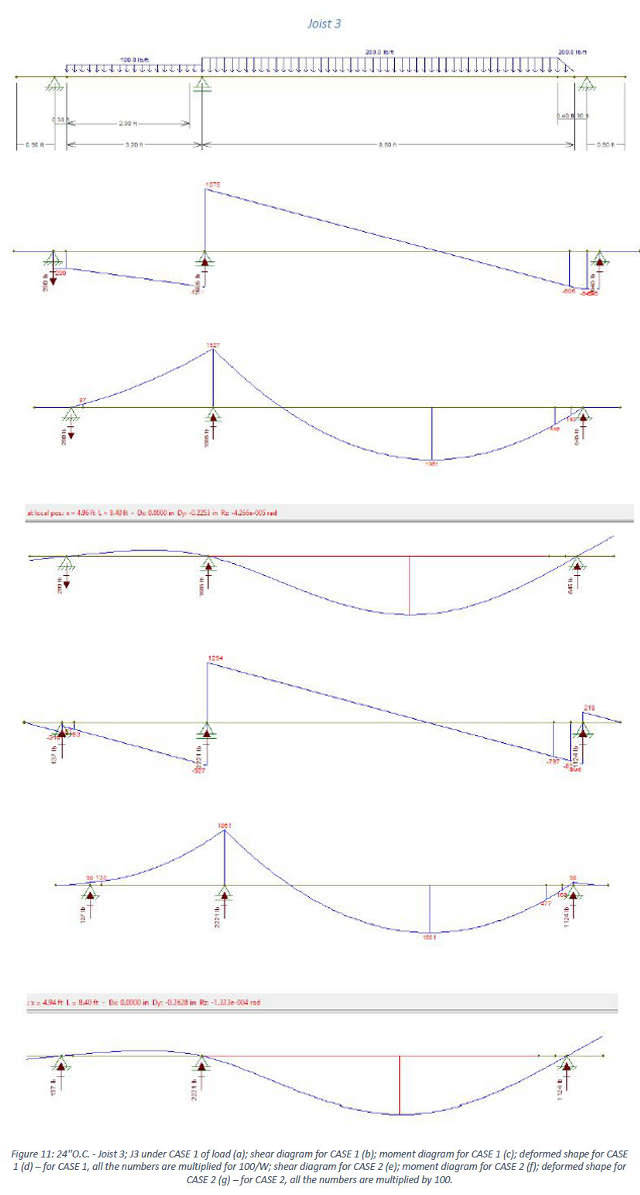
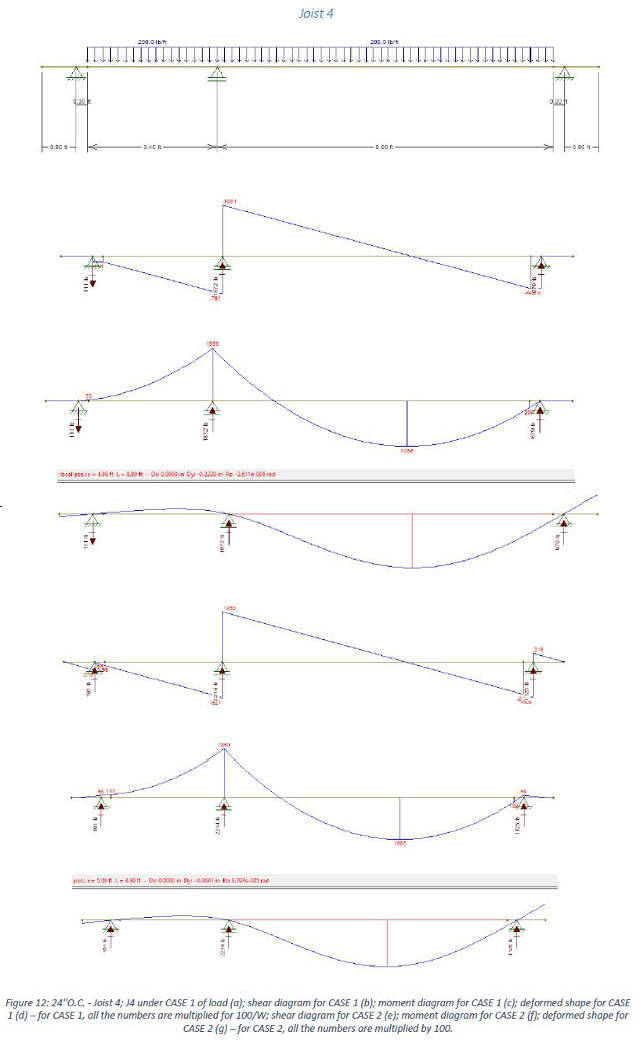
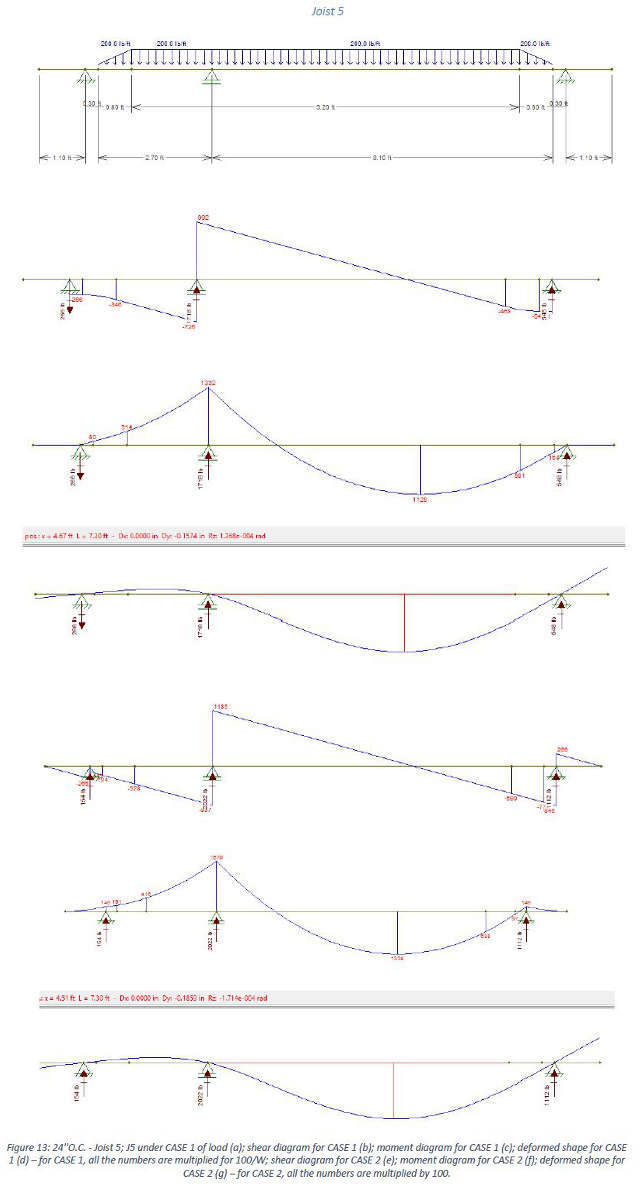
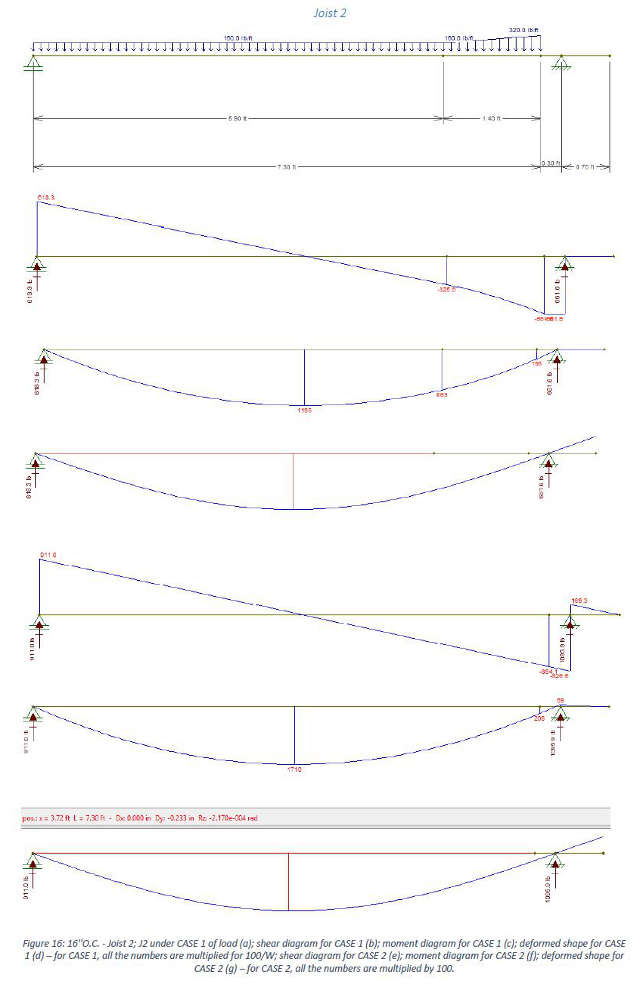
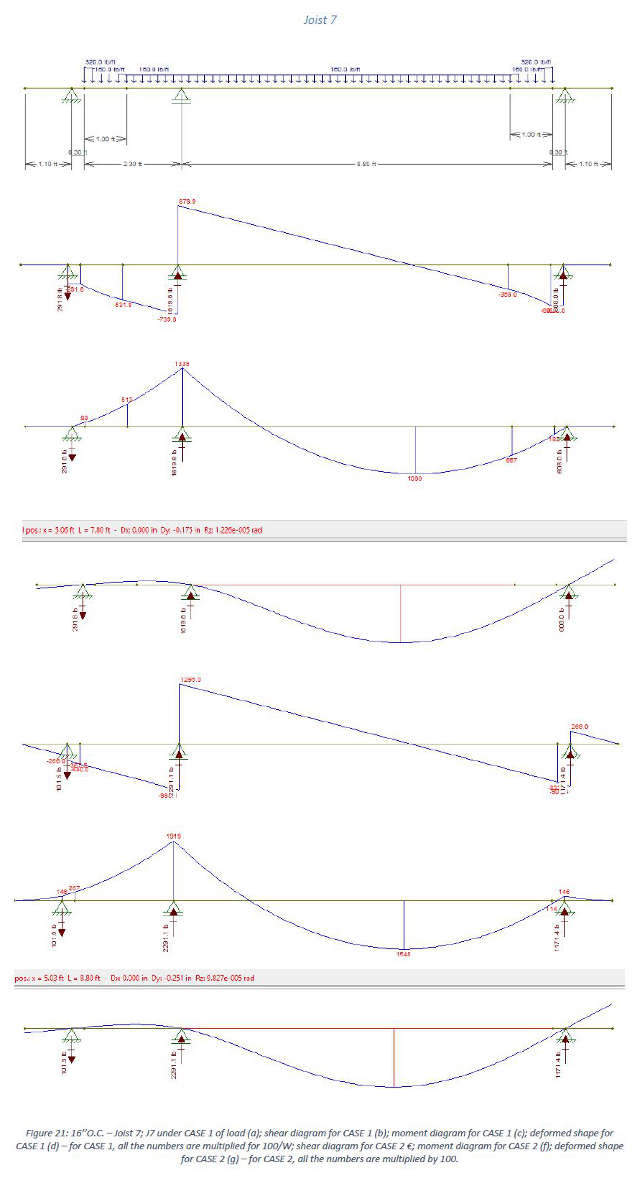
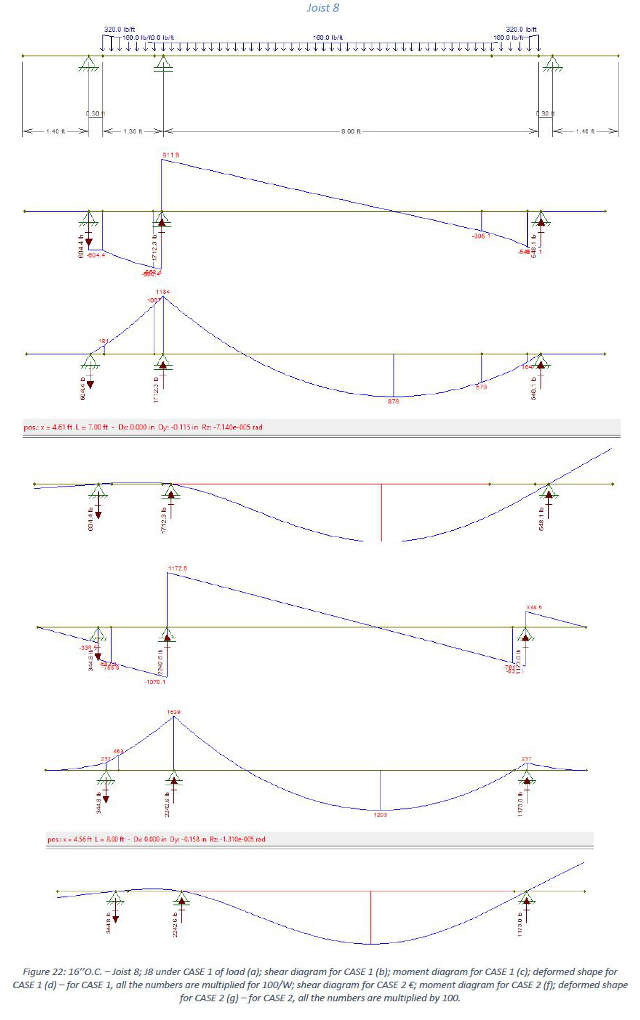
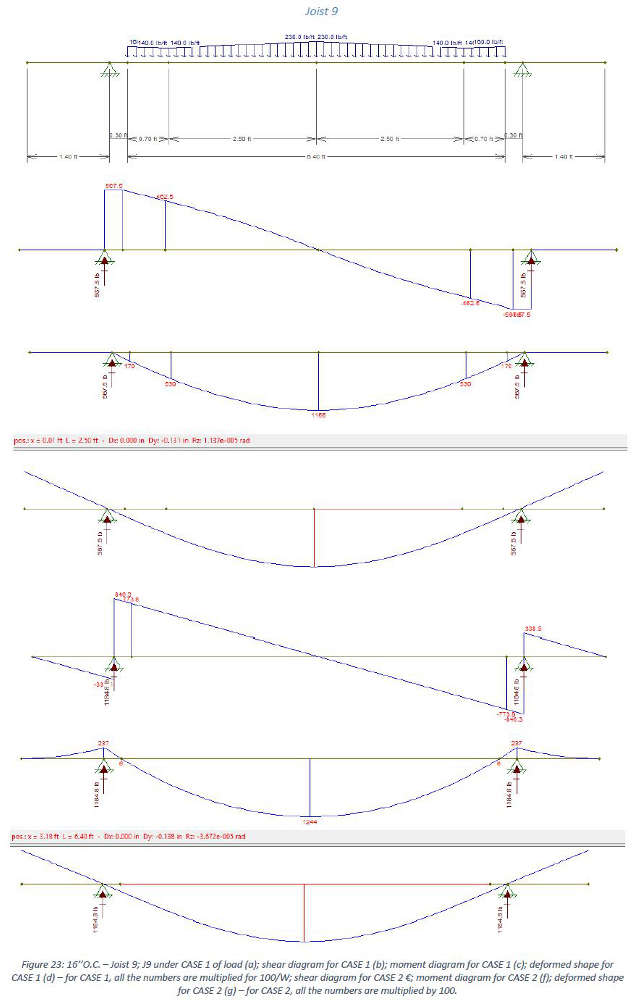
Finally, by adding those three loads we can find the total action by W over the joist 1 (CASE 1), as shown in the figure below, where all the numbers are multiplied by 100 in order to better visualize the results.

We still need to consider the action of the load D2 (CASE 2):

DESIGN VALUES
Stresses
Tabulated design values by using NDS-S (Tables 4A and 1B)
Fb = 850 psi
Fv = 180 psi
Fc⊥ = 625 psi
Fc = 1400 psi
E = 1,600,000 psi
Coefficients
Lumber property adjustments and adjusted design values (NDS•2.3)
| CD = 1.0 | CL = 1.0 |
| Cr = 1.15 | Cb = 1.0 |
| CF = 1.2 | CP = 1.0 |
| CH = 2.0 |
Corrected Stresses
Fb’= FbCrCFCDCL = 1,173 psi Fv’= FvCHCD = 360 psi
Fc⊥’= Fc⊥Cb = 625 psi
Fc’= FcCFCDCP = 1680 psi
E’ = E = 1,600,000 psi
Geometric Parameters
| (2×8’s) | (2×10’s) |
| Ixx = 47.63 in4 | Ixx = 98.93 in4 |
| Sxx = 13.14 in3 | Sxx = 21.39 in3 |
| b = 1.5 in | b = 1.5 in |
| d = 7.25 in | d = 9.25 in |
| A = 10.88 in2 | A = 13.88 in2 |
SUPPORTS
- Points in contact with the Murphy Bed Wall were considered as rolling
- The reaction due to the part where the beams are partially supported was considered concentrate (rolling), and its application point (measuring starting at the edge support) was chosen the less between half of the supported length and half of the high of the joists
RUNNING CALCULATIONS
24’’ O.C.
(2×8 Option)
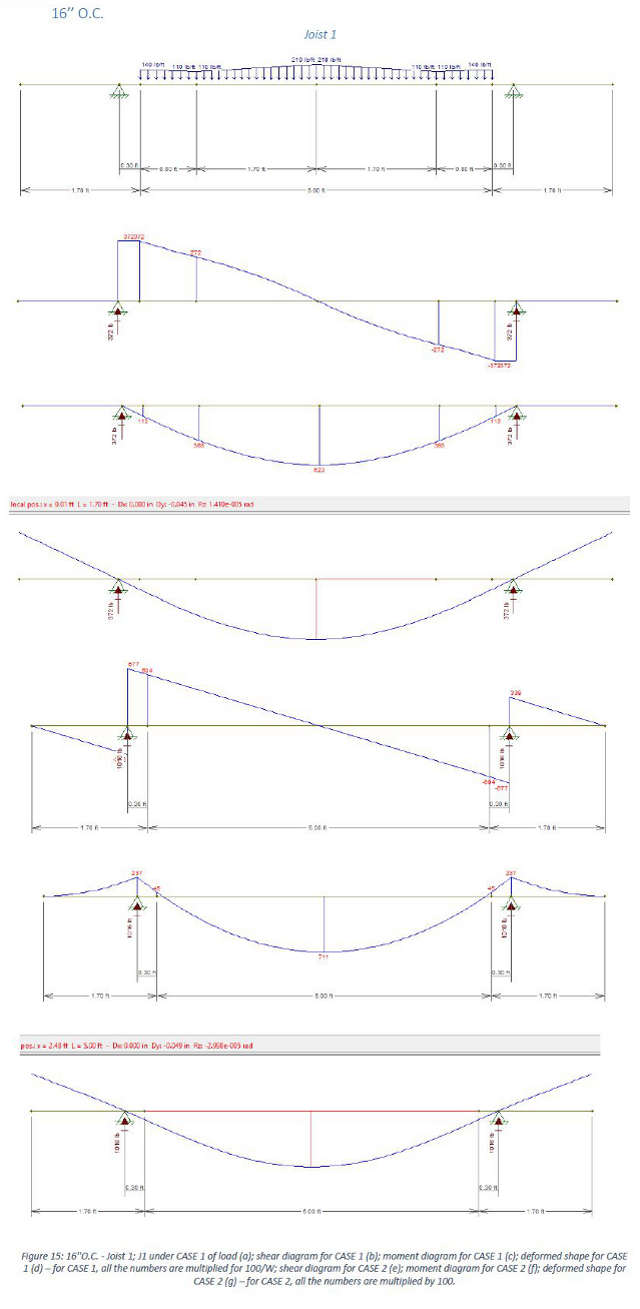
Joist 1-CASE 1 (L+D1)
; shear diagram (b); moment diagram (c); deformed shape (d). NOTE: all the numbers are multiplied by 100/W.")
; shear diagram (b); moment diagram (c); deformed shape (d).")
Joist 1 RESULTS (CASE 1 + CASE 2)
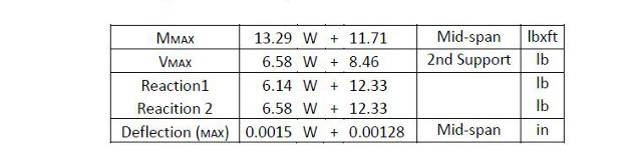
- WMAX based on bending capacity:

- WMAX based on shear capacity:

- WMAX based on bearing capacity:

- WMAX based on maximum deflection:

Other Joists
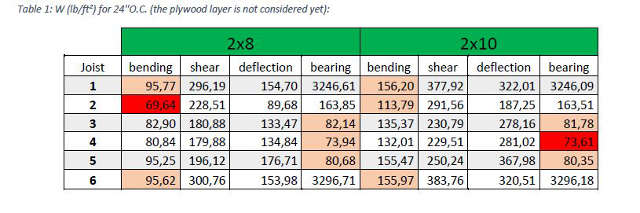
The table below summarizes the results found for 24’’O.C. Notice that increasing the cross-section from 2×8
to 2×10 we increase the load capacity from 69.64 to 73.61 lb/ft².
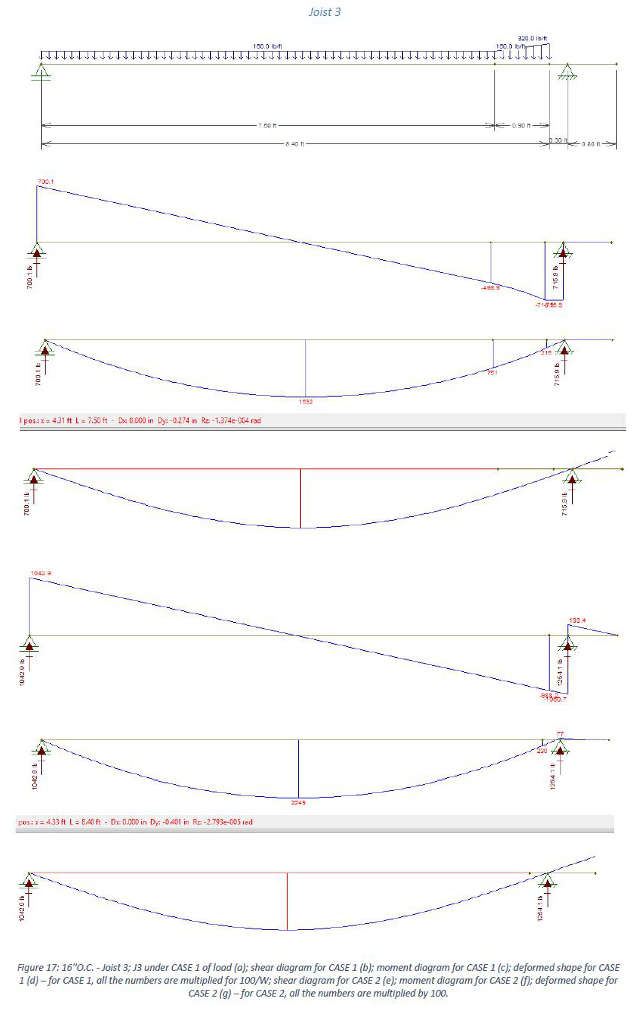
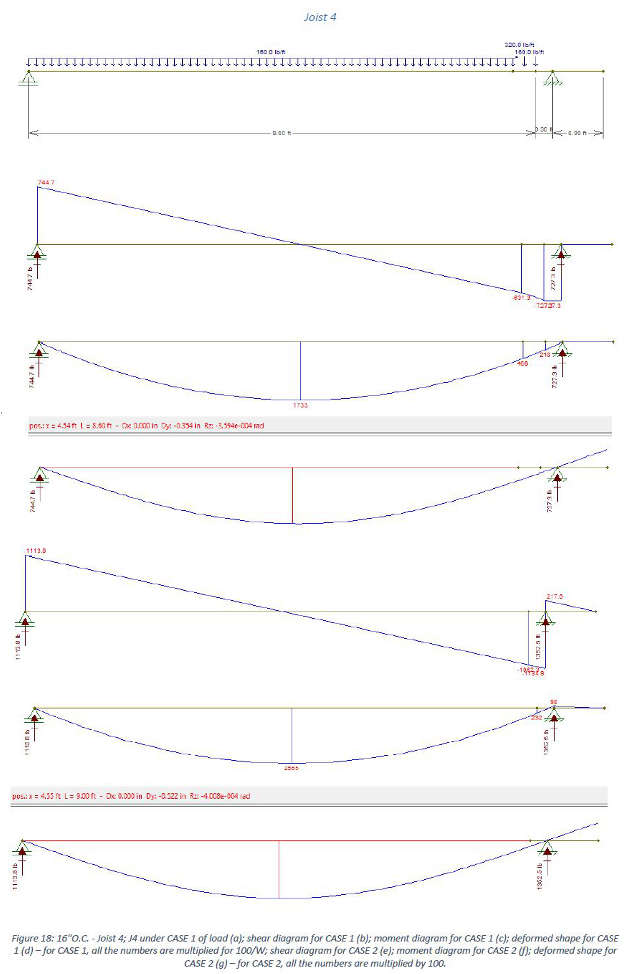
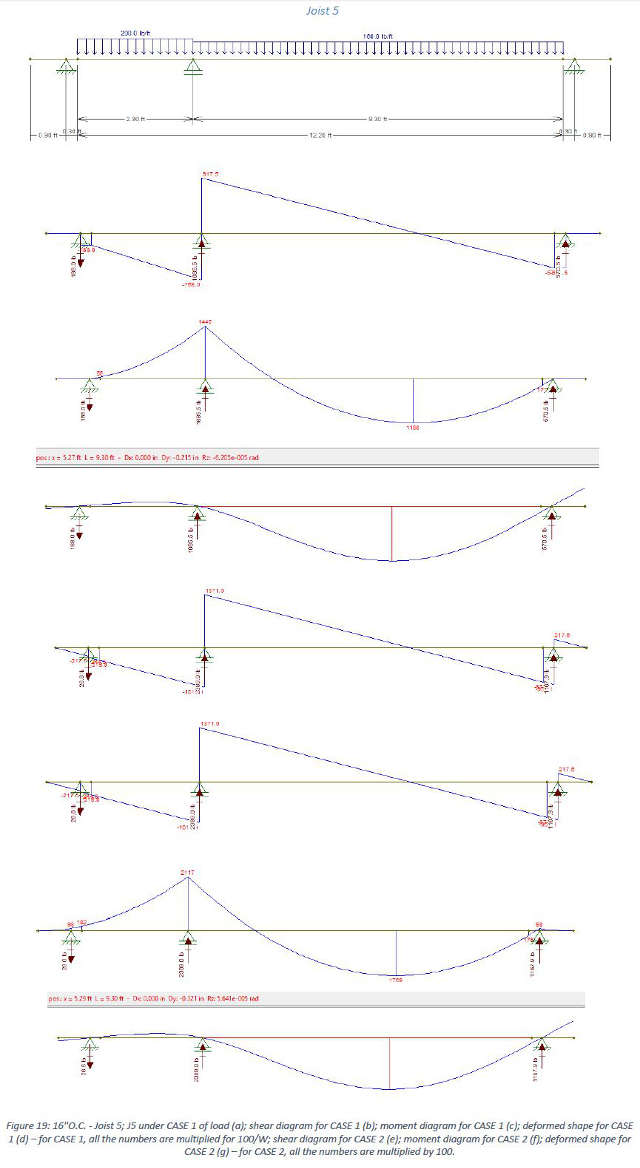
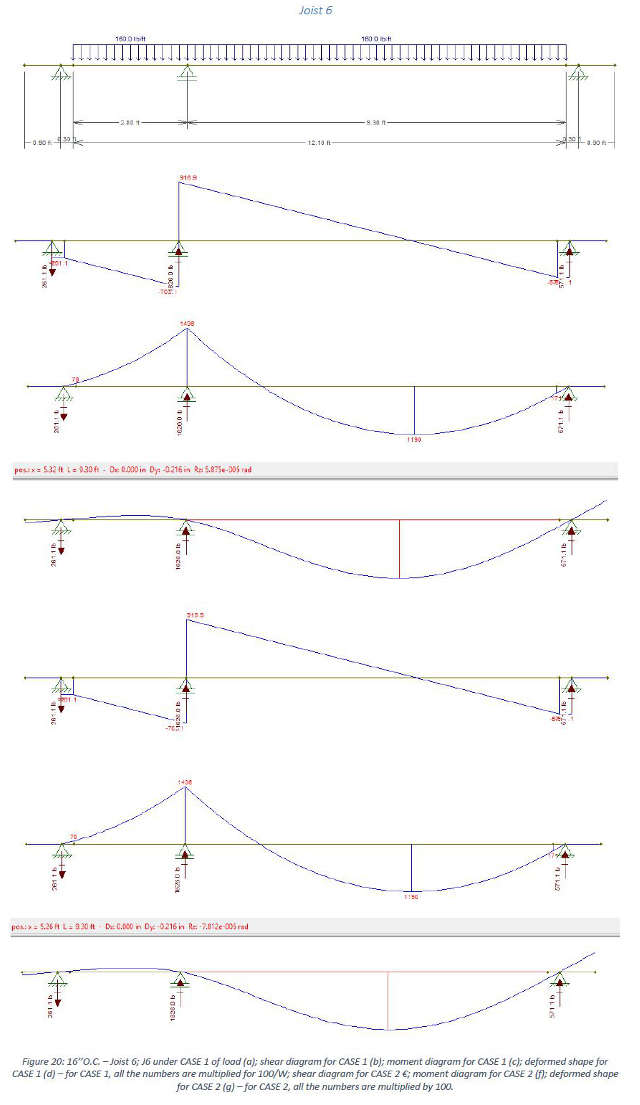
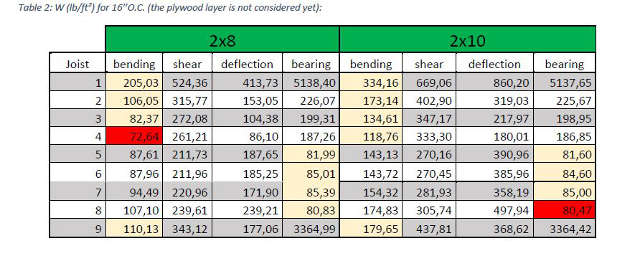
The table below summarizes the results found for 16’’O.C. Notice that increasing the cross-section from 2×8 to 2×10 we increase the load capacity from 72.64 to 80.47 lb/ft².
CONCLUSIONS AND COMMENTS
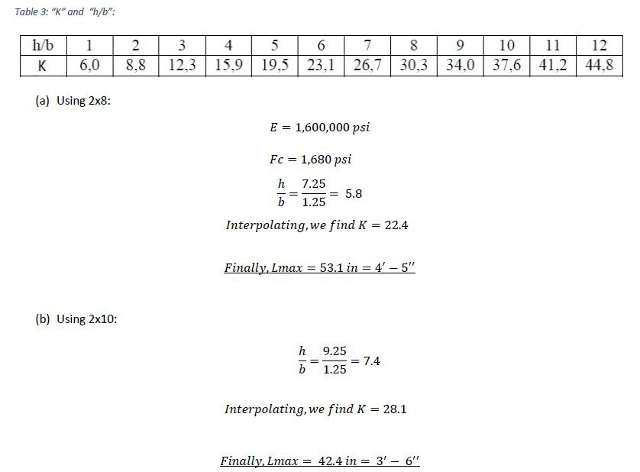
Space in Between Blockings

Where “b” is the width of the joists, “fc” is the design stress caused by compression parallel to the grains and
“k” is given by the following table and depends on the relation between the high and the width of the joists:
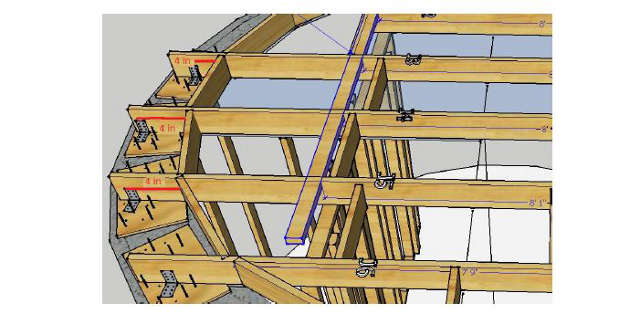
Conditions to Consider Pin Connections in the Joist
In order to satisfy the model assumed in this work, the joists should be prevented from moving both vertical and horizontally at an average distance of 0.3 ft = 4 in from the interior walls (as shown in the figure below).
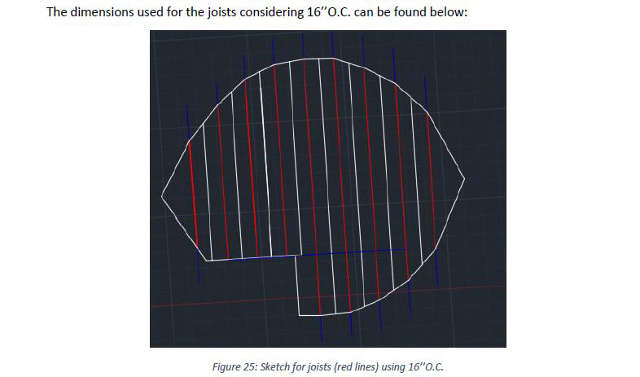
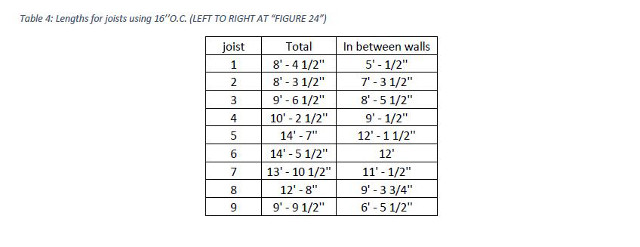
Dimensions in the Case 16’’O.C.
Plywood Layer
It is important to say that calculations were made in order to check if the joists will support the maximum load (as asked me to do). Actually, it is also needed to check if the plywood will as well. Then, I recommend this as the next work.
Final Load Capacity
Considering the plywood to be used has 2.13 lb/ft², the final load capacity (only live load) to each option of
design is:
- 69.64 – 2.13 = 67.5 lb/ft² for 2×8 joists, spaced 24 inches;
- 73.61 – 2.13 = 71.5 lb/ft² for 2×10 joists, spaced 24 inches (6% higher);
- 72.64 – 2.13 = 70.5 lb/ft² for 2×8 joists, spaced 16 inches;
- 80.47 – 2.13 = 78.3 lb/ft² for 2×10 joists, spaced 16 inches (11% higher).
coming soon….
